Tools and Project Resources
The tools and the project resources in the RIALHE project. These tools serve as essential aids in achieving our project objectives.
Learning Analytics Dashboards
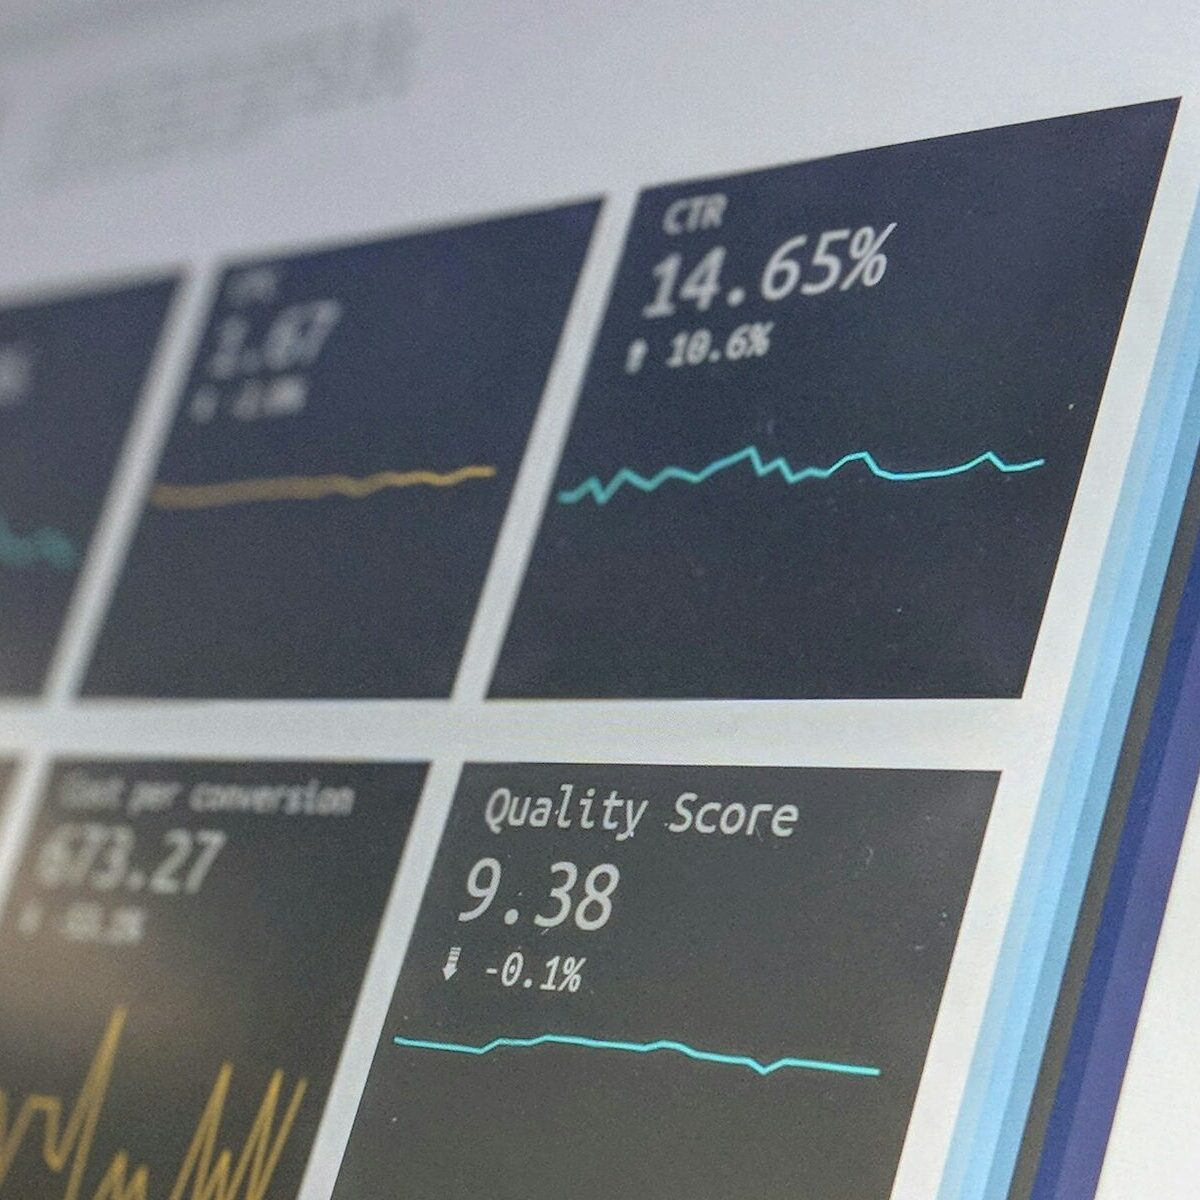
A Learning analytics dashboard is a digital tool used to track and visualize data related to learning activities or engagement of learning materials by students. It collects information/data from various sources within our project, specifically two platforms: Timeline and Ubikey. The dashboard presents the data in an accessible format, often through graphs, charts, allowing educators or instructors to gain insights into student progress, engagement and performance.
RIALHE Hardware
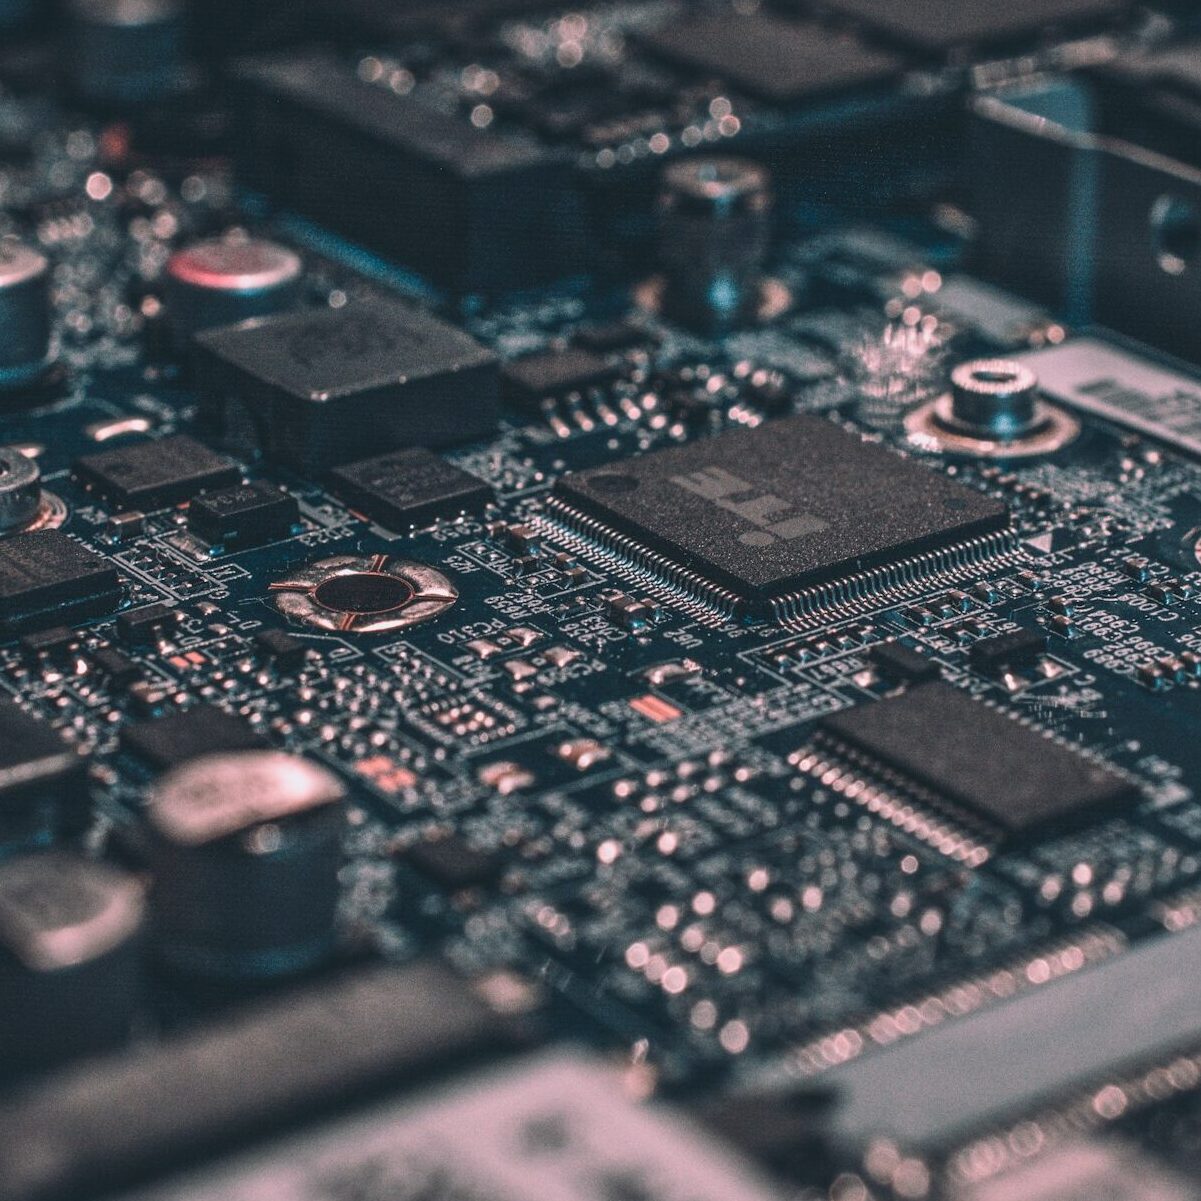
The remote labs are equipped with many devices.
- High-quality video cameras – For live streaming. This includes, wireless webcams, action cameras.
- Raspberry Pi 4 and laptop – For devices controlling and monitoring.
- Speakerphone – For conference calls.
- Networking (Switch and router) – Multiport network bridge that connects devices on a computer network.
UbiKey in RIALHE
Ubikey is a software for collaborative work. It is developed for a spacious tactile table and a tactile boards. The tables with UHD resolution screens, offer individual space, while the UHD screens on the boards facilitate information sharing among participants in an organization. These surfaces enable simultaneous interaction for enhanced teamwork.
Moreover, this system captures digital interactions, enabling the replay of sessions and providing valuable statistics on various activities such as post-it note creation and operations.
Timeline
The Timeline is an innovative instructional web tool designed to enhance learning experience with recorded live experiment sessions. Timeline offers a platform in which key aspects of a recorded live experiment session are tagged this enables users to enrich specific aspects of the experiment with close ups and detailed explanations. The timelines seamlessly integrates data collected through IoT channels, allowing users with more insights.
More precisely, the timeline consists of a chronological visual display of the experiment conceived to support an adaptive teaching and learning approach. In fact, teachers can personalize it to better meet their educational scopes, and students can navigate the Timeline according to their learning styles. Users can access the Timeline at their convenience, they can explore it starting from any segment, and view any part of it as often as desired.
